rabbit anti‑human cyclin e polyclonal antibody Search Results


96
Santa Cruz Biotechnology polyclonal goat anti tmem14a antibody
FIGURE 1 Glomerular <t>TMEM14A</t> expression was diminished before onset of proteinuria. (a) Urinary albumin excretion is significantly higher in Dahl rats compared to SHR from 6 weeks of age. Y-axis shows urinary albumin excretion in mg/24 h, and the X-axis shows animal age in weeks. (b) Glomerular TMEM14A mRNA expression in Dahl rats is significantly lower than in SHR controls at all time points. The Y-axis shows mRNA expression as relative expression compared to Hprt1, and the X-axis shows animal age in weeks. No correlation was observed between TMEM14A expression and urinary albumin excretion in both SHR (r = − 0.80, CI −0.98 to 0.27) and Dahl (r = −0.60, CI −0.97 to 0.60) using Pearson's correlation coefficient. (c) Glomerular staining for Tmem14a protein is lower in Dahl rats than in SHR after 2 weeks. This difference is significant at Weeks 4 and 8 of age. The columns represent mean semiquantitative score. Dahl rats develop proteinuria at 6 weeks of age. Thus, both mRNA and protein expression levels drop before onset of proteinuria. ANOVA with Tukey's post hoc analysis was used.(d–m) Representative images of glomeruli of spontaneously proteinuric Dahl (d–h) and SHR (i–m) rats at respectively 2 (d and i), 4 (e and j), 6 (f and k), 8 (g and l), and 10 (h and m) weeks of age. (a–c) Horizontal lines indicate mean with SD. Scale bar = 50 μm *p < 0.001.
Polyclonal Goat Anti Tmem14a Antibody, supplied by Santa Cruz Biotechnology, used in various techniques. Bioz Stars score: 96/100, based on 1 PubMed citations. ZERO BIAS - scores, article reviews, protocol conditions and more
https://www.bioz.com/result/polyclonal goat anti tmem14a antibody/product/Santa Cruz Biotechnology
Average 96 stars, based on 1 article reviews
polyclonal goat anti tmem14a antibody - by Bioz Stars, 2026-03
96/100 stars
  Buy from Supplier

97
Santa Cruz Biotechnology anti cyclin b1
FIGURE 1 Glomerular <t>TMEM14A</t> expression was diminished before onset of proteinuria. (a) Urinary albumin excretion is significantly higher in Dahl rats compared to SHR from 6 weeks of age. Y-axis shows urinary albumin excretion in mg/24 h, and the X-axis shows animal age in weeks. (b) Glomerular TMEM14A mRNA expression in Dahl rats is significantly lower than in SHR controls at all time points. The Y-axis shows mRNA expression as relative expression compared to Hprt1, and the X-axis shows animal age in weeks. No correlation was observed between TMEM14A expression and urinary albumin excretion in both SHR (r = − 0.80, CI −0.98 to 0.27) and Dahl (r = −0.60, CI −0.97 to 0.60) using Pearson's correlation coefficient. (c) Glomerular staining for Tmem14a protein is lower in Dahl rats than in SHR after 2 weeks. This difference is significant at Weeks 4 and 8 of age. The columns represent mean semiquantitative score. Dahl rats develop proteinuria at 6 weeks of age. Thus, both mRNA and protein expression levels drop before onset of proteinuria. ANOVA with Tukey's post hoc analysis was used.(d–m) Representative images of glomeruli of spontaneously proteinuric Dahl (d–h) and SHR (i–m) rats at respectively 2 (d and i), 4 (e and j), 6 (f and k), 8 (g and l), and 10 (h and m) weeks of age. (a–c) Horizontal lines indicate mean with SD. Scale bar = 50 μm *p < 0.001.
Anti Cyclin B1, supplied by Santa Cruz Biotechnology, used in various techniques. Bioz Stars score: 97/100, based on 1 PubMed citations. ZERO BIAS - scores, article reviews, protocol conditions and more
https://www.bioz.com/result/anti cyclin b1/product/Santa Cruz Biotechnology
Average 97 stars, based on 1 article reviews
anti cyclin b1 - by Bioz Stars, 2026-03
97/100 stars
  Buy from Supplier

86
Danaher Inc anti ccna2 antibody
FIGURE 1 Glomerular <t>TMEM14A</t> expression was diminished before onset of proteinuria. (a) Urinary albumin excretion is significantly higher in Dahl rats compared to SHR from 6 weeks of age. Y-axis shows urinary albumin excretion in mg/24 h, and the X-axis shows animal age in weeks. (b) Glomerular TMEM14A mRNA expression in Dahl rats is significantly lower than in SHR controls at all time points. The Y-axis shows mRNA expression as relative expression compared to Hprt1, and the X-axis shows animal age in weeks. No correlation was observed between TMEM14A expression and urinary albumin excretion in both SHR (r = − 0.80, CI −0.98 to 0.27) and Dahl (r = −0.60, CI −0.97 to 0.60) using Pearson's correlation coefficient. (c) Glomerular staining for Tmem14a protein is lower in Dahl rats than in SHR after 2 weeks. This difference is significant at Weeks 4 and 8 of age. The columns represent mean semiquantitative score. Dahl rats develop proteinuria at 6 weeks of age. Thus, both mRNA and protein expression levels drop before onset of proteinuria. ANOVA with Tukey's post hoc analysis was used.(d–m) Representative images of glomeruli of spontaneously proteinuric Dahl (d–h) and SHR (i–m) rats at respectively 2 (d and i), 4 (e and j), 6 (f and k), 8 (g and l), and 10 (h and m) weeks of age. (a–c) Horizontal lines indicate mean with SD. Scale bar = 50 μm *p < 0.001.
Anti Ccna2 Antibody, supplied by Danaher Inc, used in various techniques. Bioz Stars score: 86/100, based on 1 PubMed citations. ZERO BIAS - scores, article reviews, protocol conditions and more
https://www.bioz.com/result/anti ccna2 antibody/product/Danaher Inc
Average 86 stars, based on 1 article reviews
anti ccna2 antibody - by Bioz Stars, 2026-03
86/100 stars
  Buy from Supplier

97
Cell Signaling Technology Inc rabbit anti cyclin d1
FIGURE 1 Glomerular <t>TMEM14A</t> expression was diminished before onset of proteinuria. (a) Urinary albumin excretion is significantly higher in Dahl rats compared to SHR from 6 weeks of age. Y-axis shows urinary albumin excretion in mg/24 h, and the X-axis shows animal age in weeks. (b) Glomerular TMEM14A mRNA expression in Dahl rats is significantly lower than in SHR controls at all time points. The Y-axis shows mRNA expression as relative expression compared to Hprt1, and the X-axis shows animal age in weeks. No correlation was observed between TMEM14A expression and urinary albumin excretion in both SHR (r = − 0.80, CI −0.98 to 0.27) and Dahl (r = −0.60, CI −0.97 to 0.60) using Pearson's correlation coefficient. (c) Glomerular staining for Tmem14a protein is lower in Dahl rats than in SHR after 2 weeks. This difference is significant at Weeks 4 and 8 of age. The columns represent mean semiquantitative score. Dahl rats develop proteinuria at 6 weeks of age. Thus, both mRNA and protein expression levels drop before onset of proteinuria. ANOVA with Tukey's post hoc analysis was used.(d–m) Representative images of glomeruli of spontaneously proteinuric Dahl (d–h) and SHR (i–m) rats at respectively 2 (d and i), 4 (e and j), 6 (f and k), 8 (g and l), and 10 (h and m) weeks of age. (a–c) Horizontal lines indicate mean with SD. Scale bar = 50 μm *p < 0.001.
Rabbit Anti Cyclin D1, supplied by Cell Signaling Technology Inc, used in various techniques. Bioz Stars score: 97/100, based on 1 PubMed citations. ZERO BIAS - scores, article reviews, protocol conditions and more
https://www.bioz.com/result/rabbit anti cyclin d1/product/Cell Signaling Technology Inc
Average 97 stars, based on 1 article reviews
rabbit anti cyclin d1 - by Bioz Stars, 2026-03
97/100 stars
  Buy from Supplier

90
Santa Cruz Biotechnology anti-cyclin a c19 mouse, h432 human
FIGURE 1 Glomerular <t>TMEM14A</t> expression was diminished before onset of proteinuria. (a) Urinary albumin excretion is significantly higher in Dahl rats compared to SHR from 6 weeks of age. Y-axis shows urinary albumin excretion in mg/24 h, and the X-axis shows animal age in weeks. (b) Glomerular TMEM14A mRNA expression in Dahl rats is significantly lower than in SHR controls at all time points. The Y-axis shows mRNA expression as relative expression compared to Hprt1, and the X-axis shows animal age in weeks. No correlation was observed between TMEM14A expression and urinary albumin excretion in both SHR (r = − 0.80, CI −0.98 to 0.27) and Dahl (r = −0.60, CI −0.97 to 0.60) using Pearson's correlation coefficient. (c) Glomerular staining for Tmem14a protein is lower in Dahl rats than in SHR after 2 weeks. This difference is significant at Weeks 4 and 8 of age. The columns represent mean semiquantitative score. Dahl rats develop proteinuria at 6 weeks of age. Thus, both mRNA and protein expression levels drop before onset of proteinuria. ANOVA with Tukey's post hoc analysis was used.(d–m) Representative images of glomeruli of spontaneously proteinuric Dahl (d–h) and SHR (i–m) rats at respectively 2 (d and i), 4 (e and j), 6 (f and k), 8 (g and l), and 10 (h and m) weeks of age. (a–c) Horizontal lines indicate mean with SD. Scale bar = 50 μm *p < 0.001.
Anti Cyclin A C19 Mouse, H432 Human, supplied by Santa Cruz Biotechnology, used in various techniques. Bioz Stars score: 90/100, based on 1 PubMed citations. ZERO BIAS - scores, article reviews, protocol conditions and more
https://www.bioz.com/result/anti-cyclin a c19 mouse, h432 human/product/Santa Cruz Biotechnology
Average 90 stars, based on 1 article reviews
anti-cyclin a c19 mouse, h432 human - by Bioz Stars, 2026-03
90/100 stars
  Buy from Supplier

96
Cell Signaling Technology Inc anti cdk1 phospho tyr15 antibody
Inhibition of Cdc25A/Cdk–cyclin interactions by Thr504 phosphorylation. (A) GST-Cdc25A fusion proteins (wild type (WT), T504A, or C428S) were first incubated with GST-Δ60-Chk1 (Δ60) or its kinase-dead form (DA) and then with <t>Tyr15-phosphorylated</t> <t>Cdk1–cyclin</t> A1 complexes. The reaction mixture was then analyzed by immunoblotting using anti-Cdc25A, anti-phospho-Thr504, anti-cyclin A1, <t>or</t> <t>anti-Cdk1</t> phospho-Tyr15 antibodies. (For exact experimental conditions, see Supplementary data.) (B) Activated eggs were injected with 2 ng of mRNA encoding GST (Cont.) or GST-Cdc25A (WT or T504A), incubated for 2.5 h, reinjected or not with 2 ng of Δ60-Chk1 mRNA, and then incubated further for 1.5 h. Egg extracts (Input; equivalent to half an egg) and GST-pulled down proteins (GST-PD; equivalent to 10 eggs) were then immunoblotted for GST-Cdc25A or endogenous cyclins A1, B1, or E1 (left panel). (The blot of GST-Cdc25A in GST-PD is short-exposed.) The levels of cyclins (in both Input and GST-PD) were quantified using the NIH Image program from four independent experiments, and the levels of cyclins bound to GST-Cdc25A proteins were normalized to the input of cyclins; values obtained for WT Cdc25A (−Chk1) were set at 1.0 (right panel). (C) Extracts from the eggs expressing GST-Cdc25A proteins (together with or without Δ60-Chk1) as in (B) were mixed with extracts from the eggs expressing Myc-tagged cyclins A1 or B1 (together with Xe-Wee1B (Okamoto et al, 2002) to induce Cdk1 Tyr15 phosphorylation), incubated for 1 h at 4°C, and analyzed for GST-Cdc25A or ectopic cyclins A1 or B1 as in (B, left). (D, E) Activated eggs were injected with 2 ng of mRNA encoding wild-type GST-Cdc25A, GST-Cdc25A-ΔC23 (D) or GST-Cdc25A-3A (E), incubated for 2.5 h, and analyzed as in (B). In (B–E), all the GST-Cdc25A constructs had both S73A and C428S mutations (see text).
Anti Cdk1 Phospho Tyr15 Antibody, supplied by Cell Signaling Technology Inc, used in various techniques. Bioz Stars score: 96/100, based on 1 PubMed citations. ZERO BIAS - scores, article reviews, protocol conditions and more
https://www.bioz.com/result/anti cdk1 phospho tyr15 antibody/product/Cell Signaling Technology Inc
Average 96 stars, based on 1 article reviews
anti cdk1 phospho tyr15 antibody - by Bioz Stars, 2026-03
96/100 stars
  Buy from Supplier

93
Bethyl anti ccnt1 antibody
(A) Viral genome diagram of the two-color, HIV-1.NL4-3-derived viral reporter construct, E-R-/2FP. Early, Rev-independent viral gene expression is reported by mCherry, encoded within the nef locus. Late, Rev-dependent viral gene expression is reported by mVenus, encoded in gag as an in-frame insertion between the matrix (MA) and capsid (CA) protein coding regions. Grey rectangles denote inactivated env , vpr , and nef genes to limit virus replication to a single cycle. (B) E-R-/2FP reporter assay schematic. VSV-G pseudotyped virus particles containing E-R-/2FP genomes are delivered to target cells. Prior to infection, target cells (grey) can become mVenus-positive due to virion-associated MA-mVenus during virus particle uptake (gold). Following proviral insertion, early (red) and late (orange) viral gene expression is reported by de novo mCherry and mVenus expression, respectively. (C) Fluorescence profiles of Jurkat E6-1 cells transduced with wild-type, Tat- or Rev-deficient E-R-/2FP, or untransduced control cells. Cells exhibiting robust early and late viral gene expression are indicated (dashed circle). Dot plot is an overlay of the four indicated cell populations. (D) Species-specific <t>CCNT1</t> or XPO1 residues that govern HIV-1 Tat and Rev activity, respectively (blue). CCNT1 residue 261 governs Tat activity. XPO1 residues 411, 412, and 414 governs Rev activity. Rodents predicted from species-specific residue identity to exhibit poor Tat and Rev activities are indicated (boxed). (E) E-R-/2FP screen of various mammalian cell lines. Dashed circles highlight cells exhibiting robust early and late viral gene expression. Nevirapine treatment to block E-R-/2FP infection was to facilitate the identification of productively-infected cell populations.
Anti Ccnt1 Antibody, supplied by Bethyl, used in various techniques. Bioz Stars score: 93/100, based on 1 PubMed citations. ZERO BIAS - scores, article reviews, protocol conditions and more
https://www.bioz.com/result/anti ccnt1 antibody/product/Bethyl
Average 93 stars, based on 1 article reviews
anti ccnt1 antibody - by Bioz Stars, 2026-03
93/100 stars
  Buy from Supplier

92
Boster Bio rabbit anti phospho tyrosine 15 cdc2
(A) Viral genome diagram of the two-color, HIV-1.NL4-3-derived viral reporter construct, E-R-/2FP. Early, Rev-independent viral gene expression is reported by mCherry, encoded within the nef locus. Late, Rev-dependent viral gene expression is reported by mVenus, encoded in gag as an in-frame insertion between the matrix (MA) and capsid (CA) protein coding regions. Grey rectangles denote inactivated env , vpr , and nef genes to limit virus replication to a single cycle. (B) E-R-/2FP reporter assay schematic. VSV-G pseudotyped virus particles containing E-R-/2FP genomes are delivered to target cells. Prior to infection, target cells (grey) can become mVenus-positive due to virion-associated MA-mVenus during virus particle uptake (gold). Following proviral insertion, early (red) and late (orange) viral gene expression is reported by de novo mCherry and mVenus expression, respectively. (C) Fluorescence profiles of Jurkat E6-1 cells transduced with wild-type, Tat- or Rev-deficient E-R-/2FP, or untransduced control cells. Cells exhibiting robust early and late viral gene expression are indicated (dashed circle). Dot plot is an overlay of the four indicated cell populations. (D) Species-specific <t>CCNT1</t> or XPO1 residues that govern HIV-1 Tat and Rev activity, respectively (blue). CCNT1 residue 261 governs Tat activity. XPO1 residues 411, 412, and 414 governs Rev activity. Rodents predicted from species-specific residue identity to exhibit poor Tat and Rev activities are indicated (boxed). (E) E-R-/2FP screen of various mammalian cell lines. Dashed circles highlight cells exhibiting robust early and late viral gene expression. Nevirapine treatment to block E-R-/2FP infection was to facilitate the identification of productively-infected cell populations.
Rabbit Anti Phospho Tyrosine 15 Cdc2, supplied by Boster Bio, used in various techniques. Bioz Stars score: 92/100, based on 1 PubMed citations. ZERO BIAS - scores, article reviews, protocol conditions and more
https://www.bioz.com/result/rabbit anti phospho tyrosine 15 cdc2/product/Boster Bio
Average 92 stars, based on 1 article reviews
rabbit anti phospho tyrosine 15 cdc2 - by Bioz Stars, 2026-03
92/100 stars
  Buy from Supplier

97
Cell Signaling Technology Inc anti cyclinb1 rabbit pab
(A) Viral genome diagram of the two-color, HIV-1.NL4-3-derived viral reporter construct, E-R-/2FP. Early, Rev-independent viral gene expression is reported by mCherry, encoded within the nef locus. Late, Rev-dependent viral gene expression is reported by mVenus, encoded in gag as an in-frame insertion between the matrix (MA) and capsid (CA) protein coding regions. Grey rectangles denote inactivated env , vpr , and nef genes to limit virus replication to a single cycle. (B) E-R-/2FP reporter assay schematic. VSV-G pseudotyped virus particles containing E-R-/2FP genomes are delivered to target cells. Prior to infection, target cells (grey) can become mVenus-positive due to virion-associated MA-mVenus during virus particle uptake (gold). Following proviral insertion, early (red) and late (orange) viral gene expression is reported by de novo mCherry and mVenus expression, respectively. (C) Fluorescence profiles of Jurkat E6-1 cells transduced with wild-type, Tat- or Rev-deficient E-R-/2FP, or untransduced control cells. Cells exhibiting robust early and late viral gene expression are indicated (dashed circle). Dot plot is an overlay of the four indicated cell populations. (D) Species-specific <t>CCNT1</t> or XPO1 residues that govern HIV-1 Tat and Rev activity, respectively (blue). CCNT1 residue 261 governs Tat activity. XPO1 residues 411, 412, and 414 governs Rev activity. Rodents predicted from species-specific residue identity to exhibit poor Tat and Rev activities are indicated (boxed). (E) E-R-/2FP screen of various mammalian cell lines. Dashed circles highlight cells exhibiting robust early and late viral gene expression. Nevirapine treatment to block E-R-/2FP infection was to facilitate the identification of productively-infected cell populations.
Anti Cyclinb1 Rabbit Pab, supplied by Cell Signaling Technology Inc, used in various techniques. Bioz Stars score: 97/100, based on 1 PubMed citations. ZERO BIAS - scores, article reviews, protocol conditions and more
https://www.bioz.com/result/anti cyclinb1 rabbit pab/product/Cell Signaling Technology Inc
Average 97 stars, based on 1 article reviews
anti cyclinb1 rabbit pab - by Bioz Stars, 2026-03
97/100 stars
  Buy from Supplier

90
R&D Systems anti-human platelet-endothelial cell adhesion molecule(pecam- 1; cd3 1)
(A) Viral genome diagram of the two-color, HIV-1.NL4-3-derived viral reporter construct, E-R-/2FP. Early, Rev-independent viral gene expression is reported by mCherry, encoded within the nef locus. Late, Rev-dependent viral gene expression is reported by mVenus, encoded in gag as an in-frame insertion between the matrix (MA) and capsid (CA) protein coding regions. Grey rectangles denote inactivated env , vpr , and nef genes to limit virus replication to a single cycle. (B) E-R-/2FP reporter assay schematic. VSV-G pseudotyped virus particles containing E-R-/2FP genomes are delivered to target cells. Prior to infection, target cells (grey) can become mVenus-positive due to virion-associated MA-mVenus during virus particle uptake (gold). Following proviral insertion, early (red) and late (orange) viral gene expression is reported by de novo mCherry and mVenus expression, respectively. (C) Fluorescence profiles of Jurkat E6-1 cells transduced with wild-type, Tat- or Rev-deficient E-R-/2FP, or untransduced control cells. Cells exhibiting robust early and late viral gene expression are indicated (dashed circle). Dot plot is an overlay of the four indicated cell populations. (D) Species-specific <t>CCNT1</t> or XPO1 residues that govern HIV-1 Tat and Rev activity, respectively (blue). CCNT1 residue 261 governs Tat activity. XPO1 residues 411, 412, and 414 governs Rev activity. Rodents predicted from species-specific residue identity to exhibit poor Tat and Rev activities are indicated (boxed). (E) E-R-/2FP screen of various mammalian cell lines. Dashed circles highlight cells exhibiting robust early and late viral gene expression. Nevirapine treatment to block E-R-/2FP infection was to facilitate the identification of productively-infected cell populations.
Anti Human Platelet Endothelial Cell Adhesion Molecule(Pecam 1; Cd3 1), supplied by R&D Systems, used in various techniques. Bioz Stars score: 90/100, based on 1 PubMed citations. ZERO BIAS - scores, article reviews, protocol conditions and more
https://www.bioz.com/result/anti-human platelet-endothelial cell adhesion molecule(pecam- 1; cd3 1)/product/R&D Systems
Average 90 stars, based on 1 article reviews
anti-human platelet-endothelial cell adhesion molecule(pecam- 1; cd3 1) - by Bioz Stars, 2026-03
90/100 stars
  Buy from Supplier

98
Cell Signaling Technology Inc anti cyclin d1
(A) Viral genome diagram of the two-color, HIV-1.NL4-3-derived viral reporter construct, E-R-/2FP. Early, Rev-independent viral gene expression is reported by mCherry, encoded within the nef locus. Late, Rev-dependent viral gene expression is reported by mVenus, encoded in gag as an in-frame insertion between the matrix (MA) and capsid (CA) protein coding regions. Grey rectangles denote inactivated env , vpr , and nef genes to limit virus replication to a single cycle. (B) E-R-/2FP reporter assay schematic. VSV-G pseudotyped virus particles containing E-R-/2FP genomes are delivered to target cells. Prior to infection, target cells (grey) can become mVenus-positive due to virion-associated MA-mVenus during virus particle uptake (gold). Following proviral insertion, early (red) and late (orange) viral gene expression is reported by de novo mCherry and mVenus expression, respectively. (C) Fluorescence profiles of Jurkat E6-1 cells transduced with wild-type, Tat- or Rev-deficient E-R-/2FP, or untransduced control cells. Cells exhibiting robust early and late viral gene expression are indicated (dashed circle). Dot plot is an overlay of the four indicated cell populations. (D) Species-specific <t>CCNT1</t> or XPO1 residues that govern HIV-1 Tat and Rev activity, respectively (blue). CCNT1 residue 261 governs Tat activity. XPO1 residues 411, 412, and 414 governs Rev activity. Rodents predicted from species-specific residue identity to exhibit poor Tat and Rev activities are indicated (boxed). (E) E-R-/2FP screen of various mammalian cell lines. Dashed circles highlight cells exhibiting robust early and late viral gene expression. Nevirapine treatment to block E-R-/2FP infection was to facilitate the identification of productively-infected cell populations.
Anti Cyclin D1, supplied by Cell Signaling Technology Inc, used in various techniques. Bioz Stars score: 98/100, based on 1 PubMed citations. ZERO BIAS - scores, article reviews, protocol conditions and more
https://www.bioz.com/result/anti cyclin d1/product/Cell Signaling Technology Inc
Average 98 stars, based on 1 article reviews
anti cyclin d1 - by Bioz Stars, 2026-03
98/100 stars
  Buy from Supplier

96
Cell Signaling Technology Inc anti cdk9 2316t
3T3-L1 white preadipocytes were infected with a lentiviral vector expressing human HIRA with C-terminal dTAG and HA double tags, followed by lentiviral CRISPR/Cas9- Hira gRNA to delete endogenous Hira . At D4 of adipogenesis, cells were treated with dTAG-13 for 6h. a , Pie charts depicting the genomic distribution of HIRA binding regions at D4. b , Heat maps were aligned around the center of HIRA binding sites on promoters (6,838), primed enhancers (1,998), active enhancers (AEs, 17,862) and other regions (1,751) at D4. c , Average binding profiles of HIRA-HA, H3K27ac, S5P-Pol II, S2P-Pol II, <t>CDK9</t> and SPT6 around the center of HIRA + promoters and AEs. Normalized read counts are shown. d , Profiles of HIRA-HA, H3K27ac, S5P-Pol II, S2P-Pol II, CDK9 and SPT6 on gene bodies of HIRA + promoter-associated genes. g , ChIP–Seq profiles of HIRA-HA, H3K27ac, S5P-Pol II, S2P-Pol II, CDK9 and SPT6 were displayed on Adipoq , Mlxipl (ChREBP) and Fasn loci.
Anti Cdk9 2316t, supplied by Cell Signaling Technology Inc, used in various techniques. Bioz Stars score: 96/100, based on 1 PubMed citations. ZERO BIAS - scores, article reviews, protocol conditions and more
https://www.bioz.com/result/anti cdk9 2316t/product/Cell Signaling Technology Inc
Average 96 stars, based on 1 article reviews
anti cdk9 2316t - by Bioz Stars, 2026-03
96/100 stars
  Buy from Supplier

Image Search Results


FIGURE 1 Glomerular TMEM14A expression was diminished before onset of proteinuria. (a) Urinary albumin excretion is significantly higher in Dahl rats compared to SHR from 6 weeks of age. Y-axis shows urinary albumin excretion in mg/24 h, and the X-axis shows animal age in weeks. (b) Glomerular TMEM14A mRNA expression in Dahl rats is significantly lower than in SHR controls at all time points. The Y-axis shows mRNA expression as relative expression compared to Hprt1, and the X-axis shows animal age in weeks. No correlation was observed between TMEM14A expression and urinary albumin excretion in both SHR (r = − 0.80, CI −0.98 to 0.27) and Dahl (r = −0.60, CI −0.97 to 0.60) using Pearson's correlation coefficient. (c) Glomerular staining for Tmem14a protein is lower in Dahl rats than in SHR after 2 weeks. This difference is significant at Weeks 4 and 8 of age. The columns represent mean semiquantitative score. Dahl rats develop proteinuria at 6 weeks of age. Thus, both mRNA and protein expression levels drop before onset of proteinuria. ANOVA with Tukey's post hoc analysis was used.(d–m) Representative images of glomeruli of spontaneously proteinuric Dahl (d–h) and SHR (i–m) rats at respectively 2 (d and i), 4 (e and j), 6 (f and k), 8 (g and l), and 10 (h and m) weeks of age. (a–c) Horizontal lines indicate mean with SD. Scale bar = 50 μm *p < 0.001.

Journal: Physiological reports

Article Title: Transmembrane protein 14A protects glomerular filtration barrier integrity.

doi: 10.14814/phy2.15847

Figure Lengend Snippet: FIGURE 1 Glomerular TMEM14A expression was diminished before onset of proteinuria. (a) Urinary albumin excretion is significantly higher in Dahl rats compared to SHR from 6 weeks of age. Y-axis shows urinary albumin excretion in mg/24 h, and the X-axis shows animal age in weeks. (b) Glomerular TMEM14A mRNA expression in Dahl rats is significantly lower than in SHR controls at all time points. The Y-axis shows mRNA expression as relative expression compared to Hprt1, and the X-axis shows animal age in weeks. No correlation was observed between TMEM14A expression and urinary albumin excretion in both SHR (r = − 0.80, CI −0.98 to 0.27) and Dahl (r = −0.60, CI −0.97 to 0.60) using Pearson's correlation coefficient. (c) Glomerular staining for Tmem14a protein is lower in Dahl rats than in SHR after 2 weeks. This difference is significant at Weeks 4 and 8 of age. The columns represent mean semiquantitative score. Dahl rats develop proteinuria at 6 weeks of age. Thus, both mRNA and protein expression levels drop before onset of proteinuria. ANOVA with Tukey's post hoc analysis was used.(d–m) Representative images of glomeruli of spontaneously proteinuric Dahl (d–h) and SHR (i–m) rats at respectively 2 (d and i), 4 (e and j), 6 (f and k), 8 (g and l), and 10 (h and m) weeks of age. (a–c) Horizontal lines indicate mean with SD. Scale bar = 50 μm *p < 0.001.

Article Snippet: A commercially available polyclonal goat anti-TMEM14A antibody (Santa Cruz Biotech, sc-248,899, Dallas, TX) was used for immunohistochemical staining of TMEM14A on human and rat material.

Techniques: Expressing, Staining

FIGURE 2 Knocking down TMEM14A mRNA translation causes proteinuria. Knocking down mRNA translation of the zebrafish homologue of TMEM14A through morpholino injection results in proteinuria. (a–f) Representative immunofluorescence images of transversal sections of zebrafish proximal tubule cells after injection of a mixture of red labeled 3 kDa dextran tracer (a, c, e) and green labeled 70 kDa dextran tracer (b, d, f) in controls (a,b), TMEM14A knockdowns (C and d), and PAN injected positive controls (e,f). Dextran tracers that passed the GFB are reabsorbed by proximal tubule epithelial cells in endosomes. Thus, reabsorbed dextran tracer appears as fluorescent droplets. The number of proximal tubule reabsorption droplets was counted in a blinded manner in sections as those shown here. The arrowheads in B point out examples of counted droplets. The circled areas show high fluorescence due to dextran present in the peritubular capillaries. These areas are not counted as reabsorption droplets. The sharpness of the images in panels A through F has been enhanced by overlaying them with a digital high pass filter. (g and h) Uptake of the red 3 kDa marker (g) was used to assess tubular reabsorption function, which was intact in both TMEM14A knockdown animals and controls. In the knockdown model, significantly more 70 kDa droplets (h) have passed the GFB and were subsequently reabsorbed. Puromycin aminonucleoside (PAN) injected zebrafish were used as positive controls. Students t-test was used.(g and h) Horizontal lines indicate mean with SD. Scale bar = 20 μm.* = p < 0.05.

Journal: Physiological reports

Article Title: Transmembrane protein 14A protects glomerular filtration barrier integrity.

doi: 10.14814/phy2.15847

Figure Lengend Snippet: FIGURE 2 Knocking down TMEM14A mRNA translation causes proteinuria. Knocking down mRNA translation of the zebrafish homologue of TMEM14A through morpholino injection results in proteinuria. (a–f) Representative immunofluorescence images of transversal sections of zebrafish proximal tubule cells after injection of a mixture of red labeled 3 kDa dextran tracer (a, c, e) and green labeled 70 kDa dextran tracer (b, d, f) in controls (a,b), TMEM14A knockdowns (C and d), and PAN injected positive controls (e,f). Dextran tracers that passed the GFB are reabsorbed by proximal tubule epithelial cells in endosomes. Thus, reabsorbed dextran tracer appears as fluorescent droplets. The number of proximal tubule reabsorption droplets was counted in a blinded manner in sections as those shown here. The arrowheads in B point out examples of counted droplets. The circled areas show high fluorescence due to dextran present in the peritubular capillaries. These areas are not counted as reabsorption droplets. The sharpness of the images in panels A through F has been enhanced by overlaying them with a digital high pass filter. (g and h) Uptake of the red 3 kDa marker (g) was used to assess tubular reabsorption function, which was intact in both TMEM14A knockdown animals and controls. In the knockdown model, significantly more 70 kDa droplets (h) have passed the GFB and were subsequently reabsorbed. Puromycin aminonucleoside (PAN) injected zebrafish were used as positive controls. Students t-test was used.(g and h) Horizontal lines indicate mean with SD. Scale bar = 20 μm.* = p < 0.05.

Article Snippet: A commercially available polyclonal goat anti-TMEM14A antibody (Santa Cruz Biotech, sc-248,899, Dallas, TX) was used for immunohistochemical staining of TMEM14A on human and rat material.

Techniques: Injection, Immunofluorescence, Labeling, Fluorescence, Marker, Knockdown

FIGURE 3 TMEM14A was primarily expressed by podocytes. In vitro experiments of relative TMEM14A mRNA expression show expression relative to GAPDH expression when comparing mRNA extracts from whole kidney, purified glomeruli, human umbilical vein endothelial cells (Huvec), human embryonic kidney (HEK), and finally podocytes. Expression in podocytes, HEK and Huvec was significantly higher than in whole kidney (p < 0.001 for all groups) and then purified glomeruli (p < 0.001 for podocytes and HEK, p < 0.05 for Huvec). Podocyte expression was highest of all cells and significantly so compared to Huvec (p < 0.05). Mean and SD shown. ANOVA with Tukey's post hoc analysis was used.

Journal: Physiological reports

Article Title: Transmembrane protein 14A protects glomerular filtration barrier integrity.

doi: 10.14814/phy2.15847

Figure Lengend Snippet: FIGURE 3 TMEM14A was primarily expressed by podocytes. In vitro experiments of relative TMEM14A mRNA expression show expression relative to GAPDH expression when comparing mRNA extracts from whole kidney, purified glomeruli, human umbilical vein endothelial cells (Huvec), human embryonic kidney (HEK), and finally podocytes. Expression in podocytes, HEK and Huvec was significantly higher than in whole kidney (p < 0.001 for all groups) and then purified glomeruli (p < 0.001 for podocytes and HEK, p < 0.05 for Huvec). Podocyte expression was highest of all cells and significantly so compared to Huvec (p < 0.05). Mean and SD shown. ANOVA with Tukey's post hoc analysis was used.

Article Snippet: A commercially available polyclonal goat anti-TMEM14A antibody (Santa Cruz Biotech, sc-248,899, Dallas, TX) was used for immunohistochemical staining of TMEM14A on human and rat material.

Techniques: In Vitro, Expressing, Purification

FIGURE 4 Glomerular TMEM14A expression was increased in human proteinuric renal diseases. (a) Glomerular TMEM14A protein expression was examined in human kidney biopsies from patients with diabetic nephropathy (DN), lupus nephritis (LN), IgA nephropathy (IgAN), minimal change disease (MCD), and healthy controls. Compared to controls, TMEM14A protein expression is significantly more extensive in IgAN, LN, and MCD, but not in DN. (b–f) Representative images of glomeruli stained for TMEM14A in healthy controls (b), diabetic nephropathy (c), lupus nephritis (d), IgA nephropathy (e), and minimal change disease (f). Slides were stained with goat anti-TMEM14A antibody and immunoreactivity was assessed by diaminobenzidine. This results in a brown color which then indicates TMEM14A localization. Counterstaining with hematoxylin results in blue-purple coloring of cell nuclei. Boxes in a show the range of values between the lower and upper quartile, the whiskers show 5th–95th percentile, triangles show values lying outside the 5th–95th percentile, the line in the box shows the median, and “+” indicates the mean. The scale bar in B applies to B through f and indicates 50 μm. * = p < 0.001. ANOVA with Tukey's post hoc analysis was used.

Journal: Physiological reports

Article Title: Transmembrane protein 14A protects glomerular filtration barrier integrity.

doi: 10.14814/phy2.15847

Figure Lengend Snippet: FIGURE 4 Glomerular TMEM14A expression was increased in human proteinuric renal diseases. (a) Glomerular TMEM14A protein expression was examined in human kidney biopsies from patients with diabetic nephropathy (DN), lupus nephritis (LN), IgA nephropathy (IgAN), minimal change disease (MCD), and healthy controls. Compared to controls, TMEM14A protein expression is significantly more extensive in IgAN, LN, and MCD, but not in DN. (b–f) Representative images of glomeruli stained for TMEM14A in healthy controls (b), diabetic nephropathy (c), lupus nephritis (d), IgA nephropathy (e), and minimal change disease (f). Slides were stained with goat anti-TMEM14A antibody and immunoreactivity was assessed by diaminobenzidine. This results in a brown color which then indicates TMEM14A localization. Counterstaining with hematoxylin results in blue-purple coloring of cell nuclei. Boxes in a show the range of values between the lower and upper quartile, the whiskers show 5th–95th percentile, triangles show values lying outside the 5th–95th percentile, the line in the box shows the median, and “+” indicates the mean. The scale bar in B applies to B through f and indicates 50 μm. * = p < 0.001. ANOVA with Tukey's post hoc analysis was used.

Article Snippet: A commercially available polyclonal goat anti-TMEM14A antibody (Santa Cruz Biotech, sc-248,899, Dallas, TX) was used for immunohistochemical staining of TMEM14A on human and rat material.

Techniques: Expressing, Staining

Inhibition of Cdc25A/Cdk–cyclin interactions by Thr504 phosphorylation. (A) GST-Cdc25A fusion proteins (wild type (WT), T504A, or C428S) were first incubated with GST-Δ60-Chk1 (Δ60) or its kinase-dead form (DA) and then with Tyr15-phosphorylated Cdk1–cyclin A1 complexes. The reaction mixture was then analyzed by immunoblotting using anti-Cdc25A, anti-phospho-Thr504, anti-cyclin A1, or anti-Cdk1 phospho-Tyr15 antibodies. (For exact experimental conditions, see Supplementary data.) (B) Activated eggs were injected with 2 ng of mRNA encoding GST (Cont.) or GST-Cdc25A (WT or T504A), incubated for 2.5 h, reinjected or not with 2 ng of Δ60-Chk1 mRNA, and then incubated further for 1.5 h. Egg extracts (Input; equivalent to half an egg) and GST-pulled down proteins (GST-PD; equivalent to 10 eggs) were then immunoblotted for GST-Cdc25A or endogenous cyclins A1, B1, or E1 (left panel). (The blot of GST-Cdc25A in GST-PD is short-exposed.) The levels of cyclins (in both Input and GST-PD) were quantified using the NIH Image program from four independent experiments, and the levels of cyclins bound to GST-Cdc25A proteins were normalized to the input of cyclins; values obtained for WT Cdc25A (−Chk1) were set at 1.0 (right panel). (C) Extracts from the eggs expressing GST-Cdc25A proteins (together with or without Δ60-Chk1) as in (B) were mixed with extracts from the eggs expressing Myc-tagged cyclins A1 or B1 (together with Xe-Wee1B (Okamoto et al, 2002) to induce Cdk1 Tyr15 phosphorylation), incubated for 1 h at 4°C, and analyzed for GST-Cdc25A or ectopic cyclins A1 or B1 as in (B, left). (D, E) Activated eggs were injected with 2 ng of mRNA encoding wild-type GST-Cdc25A, GST-Cdc25A-ΔC23 (D) or GST-Cdc25A-3A (E), incubated for 2.5 h, and analyzed as in (B). In (B–E), all the GST-Cdc25A constructs had both S73A and C428S mutations (see text).

Journal:

Article Title: Chk1, but not Chk2, inhibits Cdc25 phosphatases by a novel common mechanism

doi: 10.1038/sj.emboj.7600328

Figure Lengend Snippet: Inhibition of Cdc25A/Cdk–cyclin interactions by Thr504 phosphorylation. (A) GST-Cdc25A fusion proteins (wild type (WT), T504A, or C428S) were first incubated with GST-Δ60-Chk1 (Δ60) or its kinase-dead form (DA) and then with Tyr15-phosphorylated Cdk1–cyclin A1 complexes. The reaction mixture was then analyzed by immunoblotting using anti-Cdc25A, anti-phospho-Thr504, anti-cyclin A1, or anti-Cdk1 phospho-Tyr15 antibodies. (For exact experimental conditions, see Supplementary data.) (B) Activated eggs were injected with 2 ng of mRNA encoding GST (Cont.) or GST-Cdc25A (WT or T504A), incubated for 2.5 h, reinjected or not with 2 ng of Δ60-Chk1 mRNA, and then incubated further for 1.5 h. Egg extracts (Input; equivalent to half an egg) and GST-pulled down proteins (GST-PD; equivalent to 10 eggs) were then immunoblotted for GST-Cdc25A or endogenous cyclins A1, B1, or E1 (left panel). (The blot of GST-Cdc25A in GST-PD is short-exposed.) The levels of cyclins (in both Input and GST-PD) were quantified using the NIH Image program from four independent experiments, and the levels of cyclins bound to GST-Cdc25A proteins were normalized to the input of cyclins; values obtained for WT Cdc25A (−Chk1) were set at 1.0 (right panel). (C) Extracts from the eggs expressing GST-Cdc25A proteins (together with or without Δ60-Chk1) as in (B) were mixed with extracts from the eggs expressing Myc-tagged cyclins A1 or B1 (together with Xe-Wee1B (Okamoto et al, 2002) to induce Cdk1 Tyr15 phosphorylation), incubated for 1 h at 4°C, and analyzed for GST-Cdc25A or ectopic cyclins A1 or B1 as in (B, left). (D, E) Activated eggs were injected with 2 ng of mRNA encoding wild-type GST-Cdc25A, GST-Cdc25A-ΔC23 (D) or GST-Cdc25A-3A (E), incubated for 2.5 h, and analyzed as in (B). In (B–E), all the GST-Cdc25A constructs had both S73A and C428S mutations (see text).

Article Snippet: Routinely, proteins equivalent to one egg or embryo were analyzed by immunoblotting ( Shimuta et al , 2002 ), using the above-described anti-phospho-Thr504 antibody, anti- Xenopus Cdc25A antibody ( Shimuta et al , 2002 ), anti-Myc antibody (A-14, Santa Cruz), anti-GST antibody (Z-5 or B-14, Santa Cruz), anti- Xenopus cyclin A1 or B1 antibodies (a gift from J Maller), anti- Xenopus cyclin E1 antibody (a gift from T Kishimoto), anti-Cdk1 phospho-Tyr15 antibody (♯911, Cell Signaling), anti-human Chk1 phospho-Ser345 antibody (♯2341, Cell Signaling), or anti-human 14-3-3β antibody (H8, Santa Cruz).

Techniques: Inhibition, Incubation, Western Blot, Injection, Expressing, Construct

Requirement of Cdc25A phosphorylation on Thr504 for the DNA replication checkpoint. (A, B) Activated eggs were injected with 1 ng of mRNA encoding Myc-tagged wild-type Cdc25A or indicated Myc-tagged Cdc25A mutants, reinjected 2.5 h later with 2 ng of Δ60-Chk1 mRNA, and then analyzed by immunoblotting using anti-Myc or anti-Cdk1 phospho-Tyr15 antibodies. (C–E) One-cell embryos were uninjected (Cont.) or injected with 1 ng of mRNA encoding either wild-type Cdc25A or T504A Cdc25A, cultured, and analyzed for immunoblotting (after stage 8 with anti-Cdc25A or anti-Cdk1 phospho-Tyr15 antibodies; C), for the external morphology (D) and for the percentage embryonic death at stage 11 (E).

Journal:

Article Title: Chk1, but not Chk2, inhibits Cdc25 phosphatases by a novel common mechanism

doi: 10.1038/sj.emboj.7600328

Figure Lengend Snippet: Requirement of Cdc25A phosphorylation on Thr504 for the DNA replication checkpoint. (A, B) Activated eggs were injected with 1 ng of mRNA encoding Myc-tagged wild-type Cdc25A or indicated Myc-tagged Cdc25A mutants, reinjected 2.5 h later with 2 ng of Δ60-Chk1 mRNA, and then analyzed by immunoblotting using anti-Myc or anti-Cdk1 phospho-Tyr15 antibodies. (C–E) One-cell embryos were uninjected (Cont.) or injected with 1 ng of mRNA encoding either wild-type Cdc25A or T504A Cdc25A, cultured, and analyzed for immunoblotting (after stage 8 with anti-Cdc25A or anti-Cdk1 phospho-Tyr15 antibodies; C), for the external morphology (D) and for the percentage embryonic death at stage 11 (E).

Article Snippet: Routinely, proteins equivalent to one egg or embryo were analyzed by immunoblotting ( Shimuta et al , 2002 ), using the above-described anti-phospho-Thr504 antibody, anti- Xenopus Cdc25A antibody ( Shimuta et al , 2002 ), anti-Myc antibody (A-14, Santa Cruz), anti-GST antibody (Z-5 or B-14, Santa Cruz), anti- Xenopus cyclin A1 or B1 antibodies (a gift from J Maller), anti- Xenopus cyclin E1 antibody (a gift from T Kishimoto), anti-Cdk1 phospho-Tyr15 antibody (♯911, Cell Signaling), anti-human Chk1 phospho-Ser345 antibody (♯2341, Cell Signaling), or anti-human 14-3-3β antibody (H8, Santa Cruz).

Techniques: Injection, Western Blot, Cell Culture

No requirement of 14-3-3 binding for the inhibitory effect of Thr504 phosphorylation. (A) Activated eggs expressing GST-Cdc25A proteins (together with or without Δ60-Chk1) as in Figure 4B were subjected to GST pulldown assays and analyzed by immunoblotting using anti-GST antibody or anti-human 14-3-3β antibody (which can recognize all 14-3-3 isoforms). (B) Chk1-phosphorylated GST-Cdc25A protein (wild type) was GST-pulled down from activated eggs, washed with or without 0.4% Empigen, and analyzed by immunoblotting as in (A) (left). Extracts from the eggs expressing GST-cyclin A1 (together with Xe-Wee1B; see Figure 4C legend) were treated with the indicated peptide-coupled beads and immunoblotted for cyclin A1 or 14-3-3 protein (right). See Materials and methods for details. (C) GST-Cdc25A proteins (phosphorylated or not by Chk1) and egg extracts (equivalent to 10 eggs) were both prepared as in (B) (GST-Cdc25A proteins being eluted from glutathione beads), mixed together, and incubated for 1 h at 4°C. GST-Cdc25A proteins were then immunoprecipitated with anti-Cdc25A antibody (IP) and analyzed by immunoblotting using anti-GST or anti-cyclin A1 antibodies. As control of GST-Cdc25A proteins (wild type or T504A), GST alone was used (Cont.). (D) GST-Cdc25A proteins prepared as in (C) were first incubated or not with 0.1 μg of recombinant Xenopus 14-3-3ɛ protein in 30 μl of an egg extraction buffer for 15 min at 4°C and then with (GST-)Cdk1–cyclin A1 complexes (purified from 10 eggs) for 1 h. (Xenopus 14-3-3ɛ protein can bind to phosphorylated Thr504 of Cdc25A; see Materials and methods.) The mixture was then analyzed as in (C). In (A–D), all the GST-Cdc25A constructs had both S73A and C428S mutations.

Journal:

Article Title: Chk1, but not Chk2, inhibits Cdc25 phosphatases by a novel common mechanism

doi: 10.1038/sj.emboj.7600328

Figure Lengend Snippet: No requirement of 14-3-3 binding for the inhibitory effect of Thr504 phosphorylation. (A) Activated eggs expressing GST-Cdc25A proteins (together with or without Δ60-Chk1) as in Figure 4B were subjected to GST pulldown assays and analyzed by immunoblotting using anti-GST antibody or anti-human 14-3-3β antibody (which can recognize all 14-3-3 isoforms). (B) Chk1-phosphorylated GST-Cdc25A protein (wild type) was GST-pulled down from activated eggs, washed with or without 0.4% Empigen, and analyzed by immunoblotting as in (A) (left). Extracts from the eggs expressing GST-cyclin A1 (together with Xe-Wee1B; see Figure 4C legend) were treated with the indicated peptide-coupled beads and immunoblotted for cyclin A1 or 14-3-3 protein (right). See Materials and methods for details. (C) GST-Cdc25A proteins (phosphorylated or not by Chk1) and egg extracts (equivalent to 10 eggs) were both prepared as in (B) (GST-Cdc25A proteins being eluted from glutathione beads), mixed together, and incubated for 1 h at 4°C. GST-Cdc25A proteins were then immunoprecipitated with anti-Cdc25A antibody (IP) and analyzed by immunoblotting using anti-GST or anti-cyclin A1 antibodies. As control of GST-Cdc25A proteins (wild type or T504A), GST alone was used (Cont.). (D) GST-Cdc25A proteins prepared as in (C) were first incubated or not with 0.1 μg of recombinant Xenopus 14-3-3ɛ protein in 30 μl of an egg extraction buffer for 15 min at 4°C and then with (GST-)Cdk1–cyclin A1 complexes (purified from 10 eggs) for 1 h. (Xenopus 14-3-3ɛ protein can bind to phosphorylated Thr504 of Cdc25A; see Materials and methods.) The mixture was then analyzed as in (C). In (A–D), all the GST-Cdc25A constructs had both S73A and C428S mutations.

Article Snippet: Routinely, proteins equivalent to one egg or embryo were analyzed by immunoblotting ( Shimuta et al , 2002 ), using the above-described anti-phospho-Thr504 antibody, anti- Xenopus Cdc25A antibody ( Shimuta et al , 2002 ), anti-Myc antibody (A-14, Santa Cruz), anti-GST antibody (Z-5 or B-14, Santa Cruz), anti- Xenopus cyclin A1 or B1 antibodies (a gift from J Maller), anti- Xenopus cyclin E1 antibody (a gift from T Kishimoto), anti-Cdk1 phospho-Tyr15 antibody (♯911, Cell Signaling), anti-human Chk1 phospho-Ser345 antibody (♯2341, Cell Signaling), or anti-human 14-3-3β antibody (H8, Santa Cruz).

Techniques: Binding Assay, Expressing, Western Blot, Incubation, Immunoprecipitation, Recombinant, Purification, Construct

(A) Viral genome diagram of the two-color, HIV-1.NL4-3-derived viral reporter construct, E-R-/2FP. Early, Rev-independent viral gene expression is reported by mCherry, encoded within the nef locus. Late, Rev-dependent viral gene expression is reported by mVenus, encoded in gag as an in-frame insertion between the matrix (MA) and capsid (CA) protein coding regions. Grey rectangles denote inactivated env , vpr , and nef genes to limit virus replication to a single cycle. (B) E-R-/2FP reporter assay schematic. VSV-G pseudotyped virus particles containing E-R-/2FP genomes are delivered to target cells. Prior to infection, target cells (grey) can become mVenus-positive due to virion-associated MA-mVenus during virus particle uptake (gold). Following proviral insertion, early (red) and late (orange) viral gene expression is reported by de novo mCherry and mVenus expression, respectively. (C) Fluorescence profiles of Jurkat E6-1 cells transduced with wild-type, Tat- or Rev-deficient E-R-/2FP, or untransduced control cells. Cells exhibiting robust early and late viral gene expression are indicated (dashed circle). Dot plot is an overlay of the four indicated cell populations. (D) Species-specific CCNT1 or XPO1 residues that govern HIV-1 Tat and Rev activity, respectively (blue). CCNT1 residue 261 governs Tat activity. XPO1 residues 411, 412, and 414 governs Rev activity. Rodents predicted from species-specific residue identity to exhibit poor Tat and Rev activities are indicated (boxed). (E) E-R-/2FP screen of various mammalian cell lines. Dashed circles highlight cells exhibiting robust early and late viral gene expression. Nevirapine treatment to block E-R-/2FP infection was to facilitate the identification of productively-infected cell populations.

Journal: bioRxiv

Article Title: Exploiting rodent cell blocks for intrinsic resistance to HIV-1 gene expression in human T cells

doi: 10.1101/2023.04.08.536105

Figure Lengend Snippet: (A) Viral genome diagram of the two-color, HIV-1.NL4-3-derived viral reporter construct, E-R-/2FP. Early, Rev-independent viral gene expression is reported by mCherry, encoded within the nef locus. Late, Rev-dependent viral gene expression is reported by mVenus, encoded in gag as an in-frame insertion between the matrix (MA) and capsid (CA) protein coding regions. Grey rectangles denote inactivated env , vpr , and nef genes to limit virus replication to a single cycle. (B) E-R-/2FP reporter assay schematic. VSV-G pseudotyped virus particles containing E-R-/2FP genomes are delivered to target cells. Prior to infection, target cells (grey) can become mVenus-positive due to virion-associated MA-mVenus during virus particle uptake (gold). Following proviral insertion, early (red) and late (orange) viral gene expression is reported by de novo mCherry and mVenus expression, respectively. (C) Fluorescence profiles of Jurkat E6-1 cells transduced with wild-type, Tat- or Rev-deficient E-R-/2FP, or untransduced control cells. Cells exhibiting robust early and late viral gene expression are indicated (dashed circle). Dot plot is an overlay of the four indicated cell populations. (D) Species-specific CCNT1 or XPO1 residues that govern HIV-1 Tat and Rev activity, respectively (blue). CCNT1 residue 261 governs Tat activity. XPO1 residues 411, 412, and 414 governs Rev activity. Rodents predicted from species-specific residue identity to exhibit poor Tat and Rev activities are indicated (boxed). (E) E-R-/2FP screen of various mammalian cell lines. Dashed circles highlight cells exhibiting robust early and late viral gene expression. Nevirapine treatment to block E-R-/2FP infection was to facilitate the identification of productively-infected cell populations.

Article Snippet: The remaining sample was immunoprecipitated with anti-CCNT1 antibody (Bethyl Laboratories, A303-499A) or non-specific normal rabbit IgG (Cell Signaling Technologies, 2729S) in the presence of 2,000 gel units micrococcal nuclease (New England Biolabs) for 1 hour.

Techniques: Derivative Assay, Construct, Gene Expression, Virus, Reporter Assay, Infection, Expressing, Fluorescence, Transduction, Control, Activity Assay, Residue, Blocking Assay

(A) Design schematic for CCNT1 gene knock-in editing. Approximate sequence lengths of the donor template (pink) and PCR amplicon (black) used to analyze the genomic locus. DNA sequences relevant to the edit design are shown; The PAM (bold) and guide RNA target (underlined) specify the Cas9 cleavage site (arrows). Mutations engineered into the donor template are color-coded according to their intended use. CCNT1 protein coding sequences are shown with substitutions color-coded to match the relevant DNA mutation. (B) Design schematic for XPO1 gene knock-in editing labeled as in . (C) FACS gating legend for sorted populations P1-P7. Gates P1-P4 contain cells exhibiting early, Tat-dependent viral gene expression. Gates P5-P7 contain cells exhibiting late, Tat-/Rev-dependent viral gene expression. (D) Fluorescence profiles of CCNT1- or XPO1- edited or control cells infected with E-R-/2FP with (bottom row) or without (top row) P1-P7 gate overlays. P411T, M412V, and F414S substitutions collectively termed “mPatch”. (E) Percentage of cells inoculated with E-R-/2FP within gates P1-P7 for the CCNT1 -(pink), XPO1 - (orange), and control-edited (black) cell populations. Error bars represent the standard deviation from the mean for three independent experiments. A two-tailed Student’s t -test with Welch’s correction was used to compare the indicated populations (* p ≤ 0.05). (F) Sensitivity of PCR amplicons from E-R-/2FP-inoculated, CCNT1 -edited or control cells before and after FACS. PCR amplicons (top row) were digested with BsiWI (middle row) or SacI (bottom row) to screen for amplicons containing gene knock-in for each sorted population (P1-P7, lanes 8-14 and 17-23). Unsorted E-R-/2FP-inoculated or no infection control cell populations (US, Lanes 1-5) were analyzed to demonstrate input amplicon sensitivities to the indicated restriction enzymes.

Journal: bioRxiv

Article Title: Exploiting rodent cell blocks for intrinsic resistance to HIV-1 gene expression in human T cells

doi: 10.1101/2023.04.08.536105

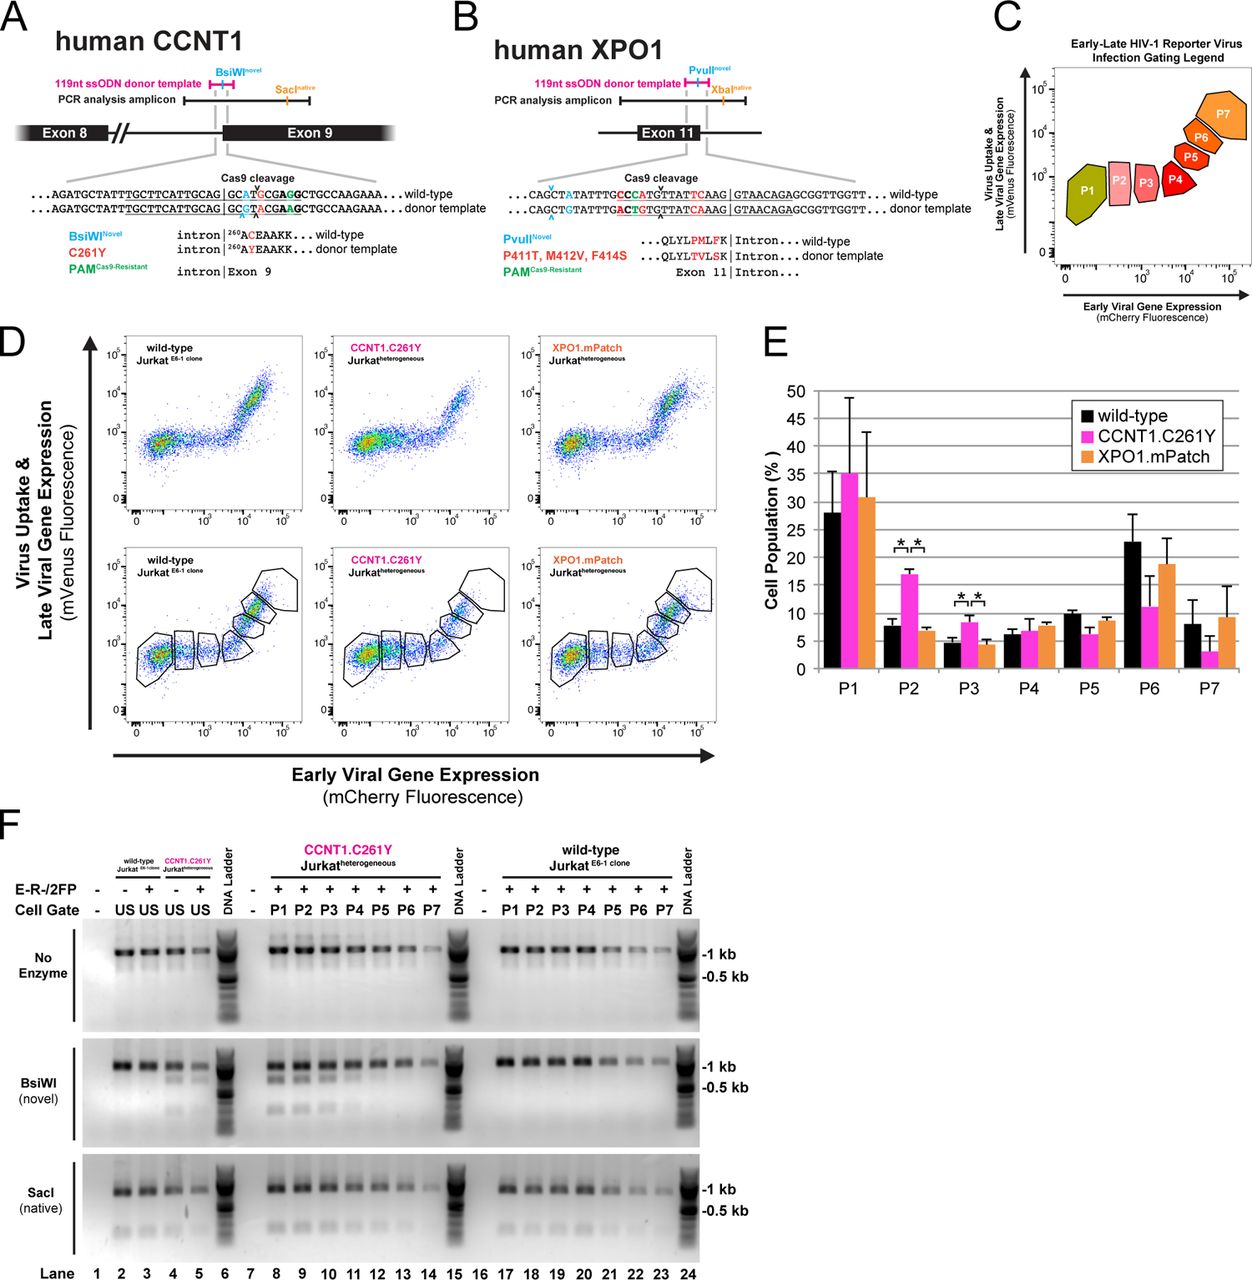
Figure Lengend Snippet: (A) Design schematic for CCNT1 gene knock-in editing. Approximate sequence lengths of the donor template (pink) and PCR amplicon (black) used to analyze the genomic locus. DNA sequences relevant to the edit design are shown; The PAM (bold) and guide RNA target (underlined) specify the Cas9 cleavage site (arrows). Mutations engineered into the donor template are color-coded according to their intended use. CCNT1 protein coding sequences are shown with substitutions color-coded to match the relevant DNA mutation. (B) Design schematic for XPO1 gene knock-in editing labeled as in . (C) FACS gating legend for sorted populations P1-P7. Gates P1-P4 contain cells exhibiting early, Tat-dependent viral gene expression. Gates P5-P7 contain cells exhibiting late, Tat-/Rev-dependent viral gene expression. (D) Fluorescence profiles of CCNT1- or XPO1- edited or control cells infected with E-R-/2FP with (bottom row) or without (top row) P1-P7 gate overlays. P411T, M412V, and F414S substitutions collectively termed “mPatch”. (E) Percentage of cells inoculated with E-R-/2FP within gates P1-P7 for the CCNT1 -(pink), XPO1 - (orange), and control-edited (black) cell populations. Error bars represent the standard deviation from the mean for three independent experiments. A two-tailed Student’s t -test with Welch’s correction was used to compare the indicated populations (* p ≤ 0.05). (F) Sensitivity of PCR amplicons from E-R-/2FP-inoculated, CCNT1 -edited or control cells before and after FACS. PCR amplicons (top row) were digested with BsiWI (middle row) or SacI (bottom row) to screen for amplicons containing gene knock-in for each sorted population (P1-P7, lanes 8-14 and 17-23). Unsorted E-R-/2FP-inoculated or no infection control cell populations (US, Lanes 1-5) were analyzed to demonstrate input amplicon sensitivities to the indicated restriction enzymes.

Article Snippet: The remaining sample was immunoprecipitated with anti-CCNT1 antibody (Bethyl Laboratories, A303-499A) or non-specific normal rabbit IgG (Cell Signaling Technologies, 2729S) in the presence of 2,000 gel units micrococcal nuclease (New England Biolabs) for 1 hour.

Techniques: Gene Knock-In, Sequencing, Amplification, Mutagenesis, Labeling, Gene Expression, Fluorescence, Control, Infection, Standard Deviation, Two Tailed Test

Late viral gene expression in XPO1 -edited cells requires elevated early viral gene expression levels. (Related to, . CRISPR/Cas9 knock-in strategy to abrogate Tat or Rev function in human CD4+ T cell lines). (A) Fluorescence profiles of XPO1 -edited (right column) or control cells (left column) infected with E-R-/2FP. P1-P7 gates, described in , are also shown. Each row represents an individual E-R-/2FP infection replicate. (B) Ratio of mCherry to mVenus fluorescence (MFI) in cells inoculated with E-R-/2FP for gates P1-P7 for the CCNT1 -, XPO1 -, and control-edited cell populations. Error bars represent the standard deviation from the mean for three independent experiments. (C) Sensitivity of PCR amplicons from E-R-/2FP-inoculated XPO1 -edited or control cells before and after FACS. PCR amplicons (top row) were digested with PvuII (middle row) or XbaI (bottom row) to screen for amplicons containing gene knock-in for each sorted population (P1-P7, lanes 8-14 and 17-23). Unsorted E-R-/2FP-inoculated or no infection control cell populations (US, Lanes 1-5) were analyzed to demonstrate input amplicon sensitivities to the indicated restriction enzymes.

Journal: bioRxiv

Article Title: Exploiting rodent cell blocks for intrinsic resistance to HIV-1 gene expression in human T cells

doi: 10.1101/2023.04.08.536105

Figure Lengend Snippet: Late viral gene expression in XPO1 -edited cells requires elevated early viral gene expression levels. (Related to, . CRISPR/Cas9 knock-in strategy to abrogate Tat or Rev function in human CD4+ T cell lines). (A) Fluorescence profiles of XPO1 -edited (right column) or control cells (left column) infected with E-R-/2FP. P1-P7 gates, described in , are also shown. Each row represents an individual E-R-/2FP infection replicate. (B) Ratio of mCherry to mVenus fluorescence (MFI) in cells inoculated with E-R-/2FP for gates P1-P7 for the CCNT1 -, XPO1 -, and control-edited cell populations. Error bars represent the standard deviation from the mean for three independent experiments. (C) Sensitivity of PCR amplicons from E-R-/2FP-inoculated XPO1 -edited or control cells before and after FACS. PCR amplicons (top row) were digested with PvuII (middle row) or XbaI (bottom row) to screen for amplicons containing gene knock-in for each sorted population (P1-P7, lanes 8-14 and 17-23). Unsorted E-R-/2FP-inoculated or no infection control cell populations (US, Lanes 1-5) were analyzed to demonstrate input amplicon sensitivities to the indicated restriction enzymes.

Article Snippet: The remaining sample was immunoprecipitated with anti-CCNT1 antibody (Bethyl Laboratories, A303-499A) or non-specific normal rabbit IgG (Cell Signaling Technologies, 2729S) in the presence of 2,000 gel units micrococcal nuclease (New England Biolabs) for 1 hour.

Techniques: Gene Expression, CRISPR, Knock-In, Fluorescence, Control, Infection, Standard Deviation, Gene Knock-In, Amplification

(A) Analysis of the CCNT1 locus by PCR amplicon restriction digest for CCNT1.C261Y clones, C1 and C2, compared to WT parental cells. (B) Sequence analysis summary for CCNT1.C261Y cells. (C) Sequence read chromatograms for CCNT1.C261Y cells. Read peaks of loci targeted for mutation are color-coded by intended purpose. (D) Western blot analysis of CCNT1 protein levels in CCNT1.C261Y cells. (E) Cell proliferation analysis of CCNT1.C261Y cells. A two-tailed Student’s t -test with Welch’s correction was used to compare C1 or C2 to wild-type parental cells at the specified time point (ns, not significant). (F) Exogenous hCCNT1, but not hCCNT1.C261Y, restores the E-R-/2FP gene expression and the wild-type fluorescence profile in CCNT1.C261Y clones, C1 and C2. Vectors encoding wild-type hCCNT1 (middle column) or hCCNT1.C261Y (right column) or control (left column) were delivered to the parental Jurkat cell line (top row, panels i.-iii.) or CCNT1.C261Y clones C1 (middle row, panels iv.-vi. ) and C2 (bottom row, panels vii.-ix. ) then infected with E-R-/2FP virus (orange) and analyzed by flow cytometry. (G) Quantitative summary of late gene expression presented in . A two-tailed Student’s t -test with Welch’s correction was used to compare CCNT1.C261Y cells expressing exogenous hCCNT1 to those expressing hCCNT1.C261Y. (H) Exogenous hCCNT1, but not hCCNT1.C261Y, restores Tat activity in an infection-independent Tat/LTR-luciferase reporter assay. Plasmids encoding luciferase under control of the HIV-1 LTR and HIV-1 Tat were delivered in combination with either hCCNT1, hCCNT1.C261Y, or a vector control by transfection. A two-tailed Student’s t -test with Welch’s correction was used to compare CCNT1.C261Y cells expressing exogenous hCCNT1 to those expressing hCCNT1.C261Y.

Journal: bioRxiv

Article Title: Exploiting rodent cell blocks for intrinsic resistance to HIV-1 gene expression in human T cells

doi: 10.1101/2023.04.08.536105

Figure Lengend Snippet: (A) Analysis of the CCNT1 locus by PCR amplicon restriction digest for CCNT1.C261Y clones, C1 and C2, compared to WT parental cells. (B) Sequence analysis summary for CCNT1.C261Y cells. (C) Sequence read chromatograms for CCNT1.C261Y cells. Read peaks of loci targeted for mutation are color-coded by intended purpose. (D) Western blot analysis of CCNT1 protein levels in CCNT1.C261Y cells. (E) Cell proliferation analysis of CCNT1.C261Y cells. A two-tailed Student’s t -test with Welch’s correction was used to compare C1 or C2 to wild-type parental cells at the specified time point (ns, not significant). (F) Exogenous hCCNT1, but not hCCNT1.C261Y, restores the E-R-/2FP gene expression and the wild-type fluorescence profile in CCNT1.C261Y clones, C1 and C2. Vectors encoding wild-type hCCNT1 (middle column) or hCCNT1.C261Y (right column) or control (left column) were delivered to the parental Jurkat cell line (top row, panels i.-iii.) or CCNT1.C261Y clones C1 (middle row, panels iv.-vi. ) and C2 (bottom row, panels vii.-ix. ) then infected with E-R-/2FP virus (orange) and analyzed by flow cytometry. (G) Quantitative summary of late gene expression presented in . A two-tailed Student’s t -test with Welch’s correction was used to compare CCNT1.C261Y cells expressing exogenous hCCNT1 to those expressing hCCNT1.C261Y. (H) Exogenous hCCNT1, but not hCCNT1.C261Y, restores Tat activity in an infection-independent Tat/LTR-luciferase reporter assay. Plasmids encoding luciferase under control of the HIV-1 LTR and HIV-1 Tat were delivered in combination with either hCCNT1, hCCNT1.C261Y, or a vector control by transfection. A two-tailed Student’s t -test with Welch’s correction was used to compare CCNT1.C261Y cells expressing exogenous hCCNT1 to those expressing hCCNT1.C261Y.

Article Snippet: The remaining sample was immunoprecipitated with anti-CCNT1 antibody (Bethyl Laboratories, A303-499A) or non-specific normal rabbit IgG (Cell Signaling Technologies, 2729S) in the presence of 2,000 gel units micrococcal nuclease (New England Biolabs) for 1 hour.

Techniques: Amplification, Clone Assay, Sequencing, Mutagenesis, Western Blot, Two Tailed Test, Gene Expression, Fluorescence, Control, Infection, Virus, Flow Cytometry, Expressing, Activity Assay, Luciferase, Reporter Assay, Plasmid Preparation, Transfection

(A) CCNT1.C261Y cells are resistant to HIV-1 replication. Representative p24 Gag antigen staining of HIV-1 infected cells 10 d post-infection. (B) Quantitative analysis of HIV-1.NL4-3- and HIV-1.IIIB-infected cell cultures 10 d post-infection by supernatant infectivity (TZM-bl luciferase assays, left bar graphs) and viral RNA content (qRT-PCR, middle bar graphs), as well as infected cell populations (p24 Gag staining, right bar graphs). A two-tailed Student’s t -test with Welch’s correction was used to compare C1 or C2 measurements to wild-type (** p ≤ 0.01). (C) Cell cultures inoculated with HIV-1.NL4-3 were sampled periodically over 1 month span for p24 Gag antigen measurements. (D) Cell cultures inoculated with the CCR5-tropic, transmitted or founder (T/F) clones, HIV-1.CH106, HIV-1.RHPA, or HIV-1.SUMA were sampled periodically over 3-week span for p24 Gag antigen measurements. (E) CCNT1.C261Y cells limit viral gene expression for HIV-1 (panels i.-iii. ), HIV-2 (panels iv.-vi. ), and SIV agm (panels vii.-ix. ) but not MLV (panels x.-xii. ). Flow cytometry histograms from one representative experiment are shown. (F) Mean fluorescence intensities (MFIs) from transduced, GFP-positive cell populations were measured in three independent experiments. A two-tailed Student’s t -test with Welch’s correction was used to compare C1 or C2 measurements to wild-type (* p ≤ 0.05; ns, not significant).

Journal: bioRxiv

Article Title: Exploiting rodent cell blocks for intrinsic resistance to HIV-1 gene expression in human T cells

doi: 10.1101/2023.04.08.536105

Figure Lengend Snippet: (A) CCNT1.C261Y cells are resistant to HIV-1 replication. Representative p24 Gag antigen staining of HIV-1 infected cells 10 d post-infection. (B) Quantitative analysis of HIV-1.NL4-3- and HIV-1.IIIB-infected cell cultures 10 d post-infection by supernatant infectivity (TZM-bl luciferase assays, left bar graphs) and viral RNA content (qRT-PCR, middle bar graphs), as well as infected cell populations (p24 Gag staining, right bar graphs). A two-tailed Student’s t -test with Welch’s correction was used to compare C1 or C2 measurements to wild-type (** p ≤ 0.01). (C) Cell cultures inoculated with HIV-1.NL4-3 were sampled periodically over 1 month span for p24 Gag antigen measurements. (D) Cell cultures inoculated with the CCR5-tropic, transmitted or founder (T/F) clones, HIV-1.CH106, HIV-1.RHPA, or HIV-1.SUMA were sampled periodically over 3-week span for p24 Gag antigen measurements. (E) CCNT1.C261Y cells limit viral gene expression for HIV-1 (panels i.-iii. ), HIV-2 (panels iv.-vi. ), and SIV agm (panels vii.-ix. ) but not MLV (panels x.-xii. ). Flow cytometry histograms from one representative experiment are shown. (F) Mean fluorescence intensities (MFIs) from transduced, GFP-positive cell populations were measured in three independent experiments. A two-tailed Student’s t -test with Welch’s correction was used to compare C1 or C2 measurements to wild-type (* p ≤ 0.05; ns, not significant).

Article Snippet: The remaining sample was immunoprecipitated with anti-CCNT1 antibody (Bethyl Laboratories, A303-499A) or non-specific normal rabbit IgG (Cell Signaling Technologies, 2729S) in the presence of 2,000 gel units micrococcal nuclease (New England Biolabs) for 1 hour.

Techniques: Staining, Infection, Luciferase, Quantitative RT-PCR, Two Tailed Test, Clone Assay, Gene Expression, Flow Cytometry, Fluorescence

(A) Virus genome diagram of R7GeMC, an established two-color reporter virus designed to discern transcriptionally-active or inactive HIV-1 proviruses. LTR-dependent viral gene expression is reported by eGFP. Inactive proviruses are reported by mCherry, encoded downstream of the constitutively-active EF1α promoter. Grey rectangles denote inactivated env and nef genes to limit virus replication to a single cycle. (B) R7GeMC reporter assay schematic. Each cell line was inoculated with VSV-G pseudotyped R7GeMC. 24 h post-inoculation, cells were sampled for fluorescence measurements and the remaining were washed to remove input virus. Cells were split into equivalent cultures and treated with HIV-1 latency reversal agents. 72 h post-inoculation, cells were harvested for fluorescence measurements. (C) Wild-type and CCNT1.C261Y cells are similarly susceptible to R7GeMC. 24 h post-inoculation, eGFP- and mCherry-positive cells and mean fluorescence intensities (MFIs) were measured. A two-tailed Student’s t-test with Welch’s correction was used to compare measurements for C1 or C2 to wild-type (ns, not significant). (D) CCNT1.C261Y cells inhibit integrated R7GeMC proviruses from escaping viral latency, even in the presence of LRAs. Overlaid dot plots of the four indicated cell populations harvested 72 h post-inoculation. (E) Percentage of eGFP-positive infected cells, indicating cells exhibiting active, LTR-dependent viral gene expression ( , “active” gate percentages). (F) Percentage of infected mCherry-positive, but transcriptionally inactive eGFP-negative cells, indicating cells with integrated proviruses that lack LTR-dependent viral gene expression ( , “inactive” gate percentages). (G) eGFP mean fluorescence intensity (MFI) in the transcriptionally-active infected cell populations ( , eGFP MFI in “active” gates).

Journal: bioRxiv

Article Title: Exploiting rodent cell blocks for intrinsic resistance to HIV-1 gene expression in human T cells

doi: 10.1101/2023.04.08.536105

Figure Lengend Snippet: (A) Virus genome diagram of R7GeMC, an established two-color reporter virus designed to discern transcriptionally-active or inactive HIV-1 proviruses. LTR-dependent viral gene expression is reported by eGFP. Inactive proviruses are reported by mCherry, encoded downstream of the constitutively-active EF1α promoter. Grey rectangles denote inactivated env and nef genes to limit virus replication to a single cycle. (B) R7GeMC reporter assay schematic. Each cell line was inoculated with VSV-G pseudotyped R7GeMC. 24 h post-inoculation, cells were sampled for fluorescence measurements and the remaining were washed to remove input virus. Cells were split into equivalent cultures and treated with HIV-1 latency reversal agents. 72 h post-inoculation, cells were harvested for fluorescence measurements. (C) Wild-type and CCNT1.C261Y cells are similarly susceptible to R7GeMC. 24 h post-inoculation, eGFP- and mCherry-positive cells and mean fluorescence intensities (MFIs) were measured. A two-tailed Student’s t-test with Welch’s correction was used to compare measurements for C1 or C2 to wild-type (ns, not significant). (D) CCNT1.C261Y cells inhibit integrated R7GeMC proviruses from escaping viral latency, even in the presence of LRAs. Overlaid dot plots of the four indicated cell populations harvested 72 h post-inoculation. (E) Percentage of eGFP-positive infected cells, indicating cells exhibiting active, LTR-dependent viral gene expression ( , “active” gate percentages). (F) Percentage of infected mCherry-positive, but transcriptionally inactive eGFP-negative cells, indicating cells with integrated proviruses that lack LTR-dependent viral gene expression ( , “inactive” gate percentages). (G) eGFP mean fluorescence intensity (MFI) in the transcriptionally-active infected cell populations ( , eGFP MFI in “active” gates).

Article Snippet: The remaining sample was immunoprecipitated with anti-CCNT1 antibody (Bethyl Laboratories, A303-499A) or non-specific normal rabbit IgG (Cell Signaling Technologies, 2729S) in the presence of 2,000 gel units micrococcal nuclease (New England Biolabs) for 1 hour.

Techniques: Virus, Gene Expression, Reporter Assay, Fluorescence, Two Tailed Test, Infection

(A) CCNT1.C261Y does not alter CDK9-CCNT1 interactions. Protein complexes purified from lysates using CCNT1 antisera were analyzed for CDK9 protein levels. Recombinant IgG (rIgG) was used to control for immunoprecipitation (IP) specificity. CDK9 levels in IP complexes were measured by semi-quantitative western blot. Error bars represent the standard deviation from the mean for three independent experiments. (B) Representative western blot for data presented in . (C) CCNT1.C261Y does not change DRB-induced p-TEFb activation responses. Parental and CCNT1.C261Y clone C1 were cultured in the presence or absence of 10 µM DRB and lysed. Cellular lysates were subjected to glycerol gradient fractionation (5%-45%) and the levels of CCNT1 and CDK9 protein were measured by semi-quantitative western blot. Error bars represent the standard deviation from the mean for three independent experiments. (D) Representative western blot for data presented in . (E) Venn diagram of the summarized differential gene expression analysis comparing CCNT1.C261Y and wild-type transcriptomes (DESeq2). Total expressed genes (16,038) were defined by a baseMean count value of ≥5. Differentially-expressed genes (DEGs, 5,168) were defined by an adjusted p-value (p*) ≤ 0.05. DEGs unique to C1 (1,274), C2 (1,851), or shared in both (2,043) are defined. DEGs that are up-regulated (1,100) or down-regulated (943) in both C1 and C2 compared to wild-type cells are defined. (F) Relative levels of cellular and Tat-dependent RNA in wild-type and C261Y cell lines. Relative RNA abundance (normalized read counts) for all expressed genes (16,038) in uninfected cells are plotted (C1, circles; C2, crosses). Tat-dependent HIV-1 transcript levels (RT-qPCR copy number; from ) are embedded for context (red, NL4-3; blue, IIIB).

Journal: bioRxiv

Article Title: Exploiting rodent cell blocks for intrinsic resistance to HIV-1 gene expression in human T cells

doi: 10.1101/2023.04.08.536105

Figure Lengend Snippet: (A) CCNT1.C261Y does not alter CDK9-CCNT1 interactions. Protein complexes purified from lysates using CCNT1 antisera were analyzed for CDK9 protein levels. Recombinant IgG (rIgG) was used to control for immunoprecipitation (IP) specificity. CDK9 levels in IP complexes were measured by semi-quantitative western blot. Error bars represent the standard deviation from the mean for three independent experiments. (B) Representative western blot for data presented in . (C) CCNT1.C261Y does not change DRB-induced p-TEFb activation responses. Parental and CCNT1.C261Y clone C1 were cultured in the presence or absence of 10 µM DRB and lysed. Cellular lysates were subjected to glycerol gradient fractionation (5%-45%) and the levels of CCNT1 and CDK9 protein were measured by semi-quantitative western blot. Error bars represent the standard deviation from the mean for three independent experiments. (D) Representative western blot for data presented in . (E) Venn diagram of the summarized differential gene expression analysis comparing CCNT1.C261Y and wild-type transcriptomes (DESeq2). Total expressed genes (16,038) were defined by a baseMean count value of ≥5. Differentially-expressed genes (DEGs, 5,168) were defined by an adjusted p-value (p*) ≤ 0.05. DEGs unique to C1 (1,274), C2 (1,851), or shared in both (2,043) are defined. DEGs that are up-regulated (1,100) or down-regulated (943) in both C1 and C2 compared to wild-type cells are defined. (F) Relative levels of cellular and Tat-dependent RNA in wild-type and C261Y cell lines. Relative RNA abundance (normalized read counts) for all expressed genes (16,038) in uninfected cells are plotted (C1, circles; C2, crosses). Tat-dependent HIV-1 transcript levels (RT-qPCR copy number; from ) are embedded for context (red, NL4-3; blue, IIIB).

Article Snippet: The remaining sample was immunoprecipitated with anti-CCNT1 antibody (Bethyl Laboratories, A303-499A) or non-specific normal rabbit IgG (Cell Signaling Technologies, 2729S) in the presence of 2,000 gel units micrococcal nuclease (New England Biolabs) for 1 hour.

Techniques: Purification, Recombinant, Control, Immunoprecipitation, Western Blot, Standard Deviation, Activation Assay, Cell Culture, Fractionation, Gene Expression, Quantitative RT-PCR

(A) Cartoon depiction of p-TEFb-dependent gene expression using either BRD4 or Tat/TAR complexes. (B) CCNT1- and BRD4-associated gene expression is largely preserved in CCNT1.C261Y cells. Heat maps displaying the log 2 FC of CCNT1 (n = 96, left) or BRD4 (n = 93, right) associated genes in the C261Y clones compared to wild-type. Individual genes sharing positive (red) or negative (blue) log 2 FC values were color-coded (adjusted p-value (p*) ≤ 0.05 (DESeq2) in both C1 and C2 cell lines). Diamond symbols (♦) denote differentially expressed genes with log 2 FC of >1 or <-1.

Journal: bioRxiv

Article Title: Exploiting rodent cell blocks for intrinsic resistance to HIV-1 gene expression in human T cells

doi: 10.1101/2023.04.08.536105

Figure Lengend Snippet: (A) Cartoon depiction of p-TEFb-dependent gene expression using either BRD4 or Tat/TAR complexes. (B) CCNT1- and BRD4-associated gene expression is largely preserved in CCNT1.C261Y cells. Heat maps displaying the log 2 FC of CCNT1 (n = 96, left) or BRD4 (n = 93, right) associated genes in the C261Y clones compared to wild-type. Individual genes sharing positive (red) or negative (blue) log 2 FC values were color-coded (adjusted p-value (p*) ≤ 0.05 (DESeq2) in both C1 and C2 cell lines). Diamond symbols (♦) denote differentially expressed genes with log 2 FC of >1 or <-1.

Article Snippet: The remaining sample was immunoprecipitated with anti-CCNT1 antibody (Bethyl Laboratories, A303-499A) or non-specific normal rabbit IgG (Cell Signaling Technologies, 2729S) in the presence of 2,000 gel units micrococcal nuclease (New England Biolabs) for 1 hour.

Techniques: Gene Expression, Clone Assay

3T3-L1 white preadipocytes were infected with a lentiviral vector expressing human HIRA with C-terminal dTAG and HA double tags, followed by lentiviral CRISPR/Cas9- Hira gRNA to delete endogenous Hira . At D4 of adipogenesis, cells were treated with dTAG-13 for 6h. a , Pie charts depicting the genomic distribution of HIRA binding regions at D4. b , Heat maps were aligned around the center of HIRA binding sites on promoters (6,838), primed enhancers (1,998), active enhancers (AEs, 17,862) and other regions (1,751) at D4. c , Average binding profiles of HIRA-HA, H3K27ac, S5P-Pol II, S2P-Pol II, CDK9 and SPT6 around the center of HIRA + promoters and AEs. Normalized read counts are shown. d , Profiles of HIRA-HA, H3K27ac, S5P-Pol II, S2P-Pol II, CDK9 and SPT6 on gene bodies of HIRA + promoter-associated genes. g , ChIP–Seq profiles of HIRA-HA, H3K27ac, S5P-Pol II, S2P-Pol II, CDK9 and SPT6 were displayed on Adipoq , Mlxipl (ChREBP) and Fasn loci.

Journal: bioRxiv

Article Title: Histone chaperone HIRA facilitates transcription elongation to regulate insulin sensitivity and obesity-associated adipose expansion

doi: 10.1101/2025.03.21.644577

Figure Lengend Snippet: 3T3-L1 white preadipocytes were infected with a lentiviral vector expressing human HIRA with C-terminal dTAG and HA double tags, followed by lentiviral CRISPR/Cas9- Hira gRNA to delete endogenous Hira . At D4 of adipogenesis, cells were treated with dTAG-13 for 6h. a , Pie charts depicting the genomic distribution of HIRA binding regions at D4. b , Heat maps were aligned around the center of HIRA binding sites on promoters (6,838), primed enhancers (1,998), active enhancers (AEs, 17,862) and other regions (1,751) at D4. c , Average binding profiles of HIRA-HA, H3K27ac, S5P-Pol II, S2P-Pol II, CDK9 and SPT6 around the center of HIRA + promoters and AEs. Normalized read counts are shown. d , Profiles of HIRA-HA, H3K27ac, S5P-Pol II, S2P-Pol II, CDK9 and SPT6 on gene bodies of HIRA + promoter-associated genes. g , ChIP–Seq profiles of HIRA-HA, H3K27ac, S5P-Pol II, S2P-Pol II, CDK9 and SPT6 were displayed on Adipoq , Mlxipl (ChREBP) and Fasn loci.

Article Snippet: Anti-S5P-Pol II (13523), anti-S2P-Pol II (13499S), anti-CDK9 (2316T) and anti-SPT6 (15616) were from Cell Signaling Technology.

Techniques: Infection, Plasmid Preparation, Expressing, CRISPR, Binding Assay, ChIP-sequencing